 Want to follow the Dow Jones, the S&P 500 or the DAX 30? Head over to TradingView! It is the No. 1 technical analysis platform. But how good is it really? Here is our TradingView review 2025!
User Reviews of the TradingView App
You can download the TradingView app for free in France. It is available on the App Store and Google Play, free of charge for Android and iOS, iPhone / iPad.
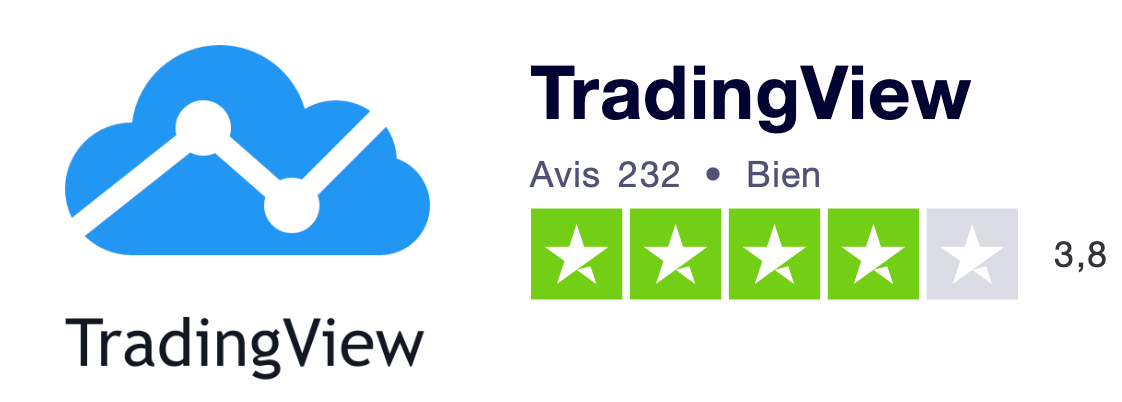
Users rate TradingView 3.9/5 at the time of writing, a good score, similar to what you will find in our Axi review.
Positive Customer Reviews
TradingView Review Topic | TradingView Customer Review | TradingView Customer Rating |
TradingView Technical Support | Good customer service | ★★★★★ 5/5 |
A Pro Trader’s Opinion of TradingView | An excellent platform for traders. Excellent customer service. It’s my best friend. | ★★★★★ 5/5 |
Recommending TradingView Pro+ | I signed up for Pro and later found out that Pro+ was more effective. I wanted to pay the difference, but that wasn’t possible. It was Thanksgiving, so I didn’t expect any support from TV… but to my great surprise, they replied quickly and sorted everything out in a few minutes. Hats off to their support team. | ★★★★★ 5/5 |
Verdict on TradingView Premium | I recently upgraded to Premium because I’m becoming a professional trader and wanted to trade on second-by-second charts. It’s worth it, and I’ve been very happy with my purchase! | ★★★★☆ 4/5 |
Advice for TradingView Users | It’s absolutely recommended for beginners and professionals alike, as it has almost every tool a trader could need. | ★★★☆☆ 3.5/5 |
A Tip for Your Trader Friends | A programmer’s best friend | ★★★★☆ 4/5 |
Selected Customer Reviews
My Mistake, But They Were Quick to Help Me Fix It
TradingView iOS app, rating: 5/5
“I use TradingView for the GER30, the CAC 40 and the S&P 500. First, the best feature is the built-in order book. Second, the app is easy to install, and I don’t know anyone who has struggled to set up TradingView, because there is a tutorial. Finally, the best part is that anyone can use TradingView: it’s free.
OK, there are alternatives to TradingView, but the main advantage is how easy it is to spot arbitrage opportunities. And you get every market! On top of that, with the API, TradingView lets me switch from EUR to USD or even CAD, test pairs like EURUSD or EURAUD, and basically feed everything into my automated trading bot to get the most out of TradingView.”
TradingView’s Chart Setup Is Excellent, Except…
TradingView iOS app, rating: 0/5
“As a Forex professional, I find TradingView’s charts excellent. For example, for trading the DAX, CAC 40 and Nasdaq with TradingView’s Fibonacci indicators. I also use it a lot to follow the British pound (GBP)! And on TradingView I have access to everything: USDCHF, USDJPY, GBPNZD, GBPCAD, GBPUSD and GBPJPY.
One flaw: Fibonacci drawings on charts are not always saved. That is a real shame, because I lost money when those drawings disappeared. I’m currently moving to the eToro platform, and I’ll drop my TradingView training once I’m done, because I can’t keep using an unreliable charting platform.”
I Highly Recommend This Platform
TradingView iOS app, rating: 5/5
“We have been using the TradingView mobile app for two years. I trade the S&P 500 as well as the DAX cash, the DJ30 and the CAC 40, and it’s very convenient to have everything in one place. After trying other trading platforms, we are very satisfied with this one. It’s as user-friendly as a forum, installation is quick and TradingView is easy to set up. There are more sophisticated platforms out there, but the TradingView app works on both Apple and Android, unlike its competitors.”
4 Stars for an Excellent Platform
TradingView iOS app, rating: 4/5
“I use TradingView for markets like EURCHF, EURGBP, EURCAD, AUDUSD, EURNZD and EURJPY on iOS with my iPhone XS, and I love it. They make a genuine effort to roll out updates in a timely manner.
Actually, 4 stars rather than 5 for one reason only: I hope that one day the app will offer a read-only view for iPad and iPhone. Sometimes you forget to tap reload and all your hard work setting up charts falls apart. There is no recovery mode either. I end up having to close the app every time I close my iPad. Otherwise, it’s a truly wonderful platform. Traders and investors can publish an idea on TradingView just like on a social network.”
Negative Customer Reviews
TradingView Review Topic | TradingView Customer Review | TradingView Customer Rating |
A Warning About TradingView Customer Service | They may be excellent at charts, but I have no interest in doing business with a company that is ruthless and inflexible with its users. It says a lot about who they are as a company: they are far more interested in making money than in serving their customers. | ★☆☆☆☆ 1/5 |
Heads-up: TradingView customer service is nowhere to be found. | I love TradingView. The first 30 days kept me busy discovering the features. Before the trial ended, I chose the entry-level plan. For some obscure reason, the renewal was cancelled and I didn’t see the emails about the failed attempt. Now I have no way of contacting support to get an answer. | ★☆☆☆☆ 1/5 |
Bad News for TradingView | After my 30-day free trial, I wanted to upgrade to the Pro version. But I got an error message from PayPal and I can’t find any option to pay by debit card on TradingView. Too bad! | ★☆☆☆☆ 1.5/5 |
Suggested Improvements for TradingView | Decent charting, but overall a negative customer experience. The typical “we’ve reported the bug” as the only response. | ★☆☆☆☆ 1.5/5 |
TradingView: Poor-Quality Customer Service | Customer service is terrible or non-existent. Impossible to open a ticket today or get an answer. You’re left to fend for yourself. There is far better charting software available elsewhere. | ☆☆☆☆☆ 0/5 |
A Recurring TradingView Problem | Not a good experience: I was charged for my trial, which I couldn’t cancel! Anyone else had a similar problem? And I can’t contact them! | ☆☆☆☆☆ 0/5 |
What Is TradingView?
TradingView, also known simply as “TV”, is a platform for viewing the prices of listed assets. Founded in 2011, it brings together prices from the world’s main stock exchanges: NASDAQ, CAC 40, DAX 40, S&P 500… You will also find commodities such as gold (XAUUSD) and silver (XAGUSD). There is no need to list them all: TradingView has every price.
Its primary aim is to give users a platform for discovering the stock markets. Whether you are a trader or simply an investor, and whether you are interested in Forex or the DAX 30 (also called the GER30, the German stock index), you need to look at market charts.
In France, the AMF does not need to regulate TradingView, because it is not a broker but a trading platform, like MT4 or MT5.

While it specializes in charting, TradingView is also a social network built around sharing trading analysis. You can interact with other users, join live streams, read analyses in the feed and follow your favorite traders.
Services Offered

TradingView offers a wide range of services, including indicators, trading options, display options and many other features that the average user discovers as they get to grips with the platform. You can also use free market analysis tools that help you understand the markets better. In the example below, you can see at a glance the key information on the Forex market‘s major pairs.

Pricing
Many tools on the TradingView website are free. No account is needed to access these resources, which include:
- A wide variety of drawing tools and hundreds of chart indicators. However, you can only display 3 at a time.
- News, ideas, a community and real-time information
- All listed financial products
- A range of alerts you can set up to suit your needs
- An optimized search function to find the assets you are looking for

The free plan does not give you access to TradingView’s full power. That comes with 3 paid plans:
- The cheapest of the 3 paid plans, the Pro account gives you an ad-free TradingView. You get more advanced customization, particularly for watchlists, and you can display 5 indicators per chart, 2 more than with the free plan.
- The mid-tier Pro+ subscription gives you between 5 and 10 indicators per chart, 4 charts per layout, and exportable data.
- The Premium plan offers extremely precise charts (20,000 bars per chart), and you can stack up to 25 technical indicators on one chart.
The Forex Tab on TradingView
All US dollar pairs, such as
- USDJPY, the dollar against the Japanese yen,
- USDCAD, the dollar against the Canadian dollar,
- USDNZD, the dollar against the New Zealand dollar,
- USDGBP, the dollar against the pound,
- USDEUR, the dollar against the euro, and
- USDCHF, the dollar against the Swiss franc.
To find the best Forex broker, read our article: What Is the Best Forex Broker?
All these strengths make TradingView the No. 1 platform in the world. Really? Here is our verdict.
What Does TradingView Offer?
Not only does TradingView have a user experience on a par with the busiest, best-performing websites in the world, but this exceptional platform also brings together every tool and feature you need to get a clear view of market conditions.
TradingView Review: Technical Analysis
Technical analysis is the discipline behind chart reading, and it is the foundation of trading. To carry out technical analysis, a trader needs access to charts, so the quality of the analysis depends on the quality of the charts.
Price charts, also called stock charts or simply charts, are scrutinized by traders all over the world thanks to TradingView. That is because price is not a fixed thing, even though most people assume it is.
When you buy something at the bakery, such as a baguette or a pain au chocolat, the price is unlikely to change between you and the next customer. Consumer prices are therefore an indication of a product’s value for ordinary citizens.
Prices are determined in the financial markets. There, buyers and sellers are brought together by their respective brokers. Supply meets demand, and you get the free market Adam Smith dreamed of.
On stock exchanges, prices fluctuate constantly. As a result, a price no longer represents the concrete value of an asset or a company, but rather investors’ confidence, or lack of it, in that asset or company. This is why the price on a chart should be read as the first indicator at your disposal.
Here is what the TradingView platform looks like when you open a chart:

Trading with TradingView
Although it specializes in charting prices, TradingView also develops research and social networking through its website. While TradingView does not specialize in live trading, it works with a number of brokers to provide this essential service.
List of Brokers Supported by TradingView
Here is the list, published by TradingView, of brokers supported for placing orders directly through Tradingview.com:
- TradeStation
- FXCM
- Gemini
- Saxo
- WH Selfinvest
- Tradovate (futures)
- AMP Global (futures)
Spreads at the Leading Forex Brokers
BROKER | EURUSD | USDJPY | EURGBP | GBPUSD | USDCHF | AUDUSD | USDCAD | EURCHF |
|---|---|---|---|---|---|---|---|---|
 TRY IT | 0.5 | 1 | 1.7 | 1.2 | 1.6 | 0.9 | 1.7 | 1.7 |
 TRY IT | 0.9 | 1.1 | 1.5 | 1.6 | 1.6 | 1.1 | 2 | 2 |
TradingView is also compatible with API software.
Placing Orders on TradingView
To trade on the TradingView website, you first need to open an account with a compatible broker.
You can connect to your broker from the TradingView dashboard. Once connected, you can trade directly from TradingView’s charts.
To use TradingView’s broker feature, besides connecting to a compatible broker, you need an account funded with €25,000. The TradingView trading account offers:
- Level 2 quotes
- Handling fees
- 4x leverage for day trading
- 2x leverage on trades held open between market sessions (overnight)
- Extended trading hours (pre-market)
Customer Service
Finding your way around TradingView is not always easy. While chart readability and the charting interface are excellent, navigating the various menus is harder. For help, go to tradingview.com/support/.
This section is divided into categories based on users’ questions. There is a large FAQ section in which you will have to do your best to find answers. Be aware that customer and after-sales service is one of the aspects users criticize most.
If the pre-written answers don’t solve your problem, free account holders are out of luck. The section for submitting a ticket and asking for help is reserved for paid accounts. And even paying users will need patience and should expect refusals.
Finally, TradingView is one of those internet giants you cannot reach by phone or live chat for customer support.
What Is Paper Trading?
Paper trading is simulated trading, a bit like playing with Monopoly money. Paper trading on TradingView is a virtual portfolio simulation. You place orders just as you would with a broker, and everything is the same, except that you don’t stake any money, so you neither win nor lose anything. It is an excellent tool for practicing.
TradingView’s virtual portfolio, rating: 5/5.
Keyboard Shortcuts
Getting to grips with the site can take some effort. There are a host of new settings to learn when you start out. Even if you are an experienced or expert trader, you will have to learn to navigate a platform you don’t know. To help, TradingView provides a wide range of keyboard shortcuts that will transform your user experience. You can view the list of TradingView shortcuts at this address.
Which Broker Should You Choose for Trading?
What Is Backtesting?
Backtesting means testing your trading strategy on historical data, which is possible thanks to the data provided by TradingView. For example, if your strategy is to sell as soon as the price crosses its 50-period moving average, you can look back in time to see whether this signal was a good sell signal. It is a way of testing your ideas. If your backtesting produces positive results, you can then go live!
The Idea Publishing Tool
What does publishing an idea mean? Well, TradingView is a social network for traders.
The bonus? Once online, your idea becomes an interactive chart where the price is tracked in real time. Your followers can watch your prediction play out live!
At the same time, you have access to the analyses posted by other traders. That gives you a genuine database on top of the classic analysis tools. Just like on a forum, you share your ideas and discover new ones, which lets you put your market analysis to the test. You can also find an outstanding trader and follow them to mirror their moves and share their conclusions.
This is TradingView’s great strength and its major innovation.

TradingView’s Referral Program
TradingView’s affiliate program has two parts:
- The first is refer-a-friend, the good old referral link. You refer a friend and receive €30 worth of TradingView Coins. You can then use these coins for trades or fees.
- The second is the sponsored partnership. You become an official TradingView affiliate representative and receive 30% in euros of everything your referrals spend. How do you reach this affiliate holy grail? By getting 100 referrals! Good luck!
More information here.
 Diversifiez votre patrimoineInvestissez dans l’artDes tableaux originaux, pièces uniques signées par l’artiste. Un actif tangible, loin des écrans et des cotations.Voir les tableaux →
Arbitrage on TradingView
It is the safest way to make money in the markets.
What Is Arbitrage?
Let’s take an example.
Suppose the price of gold falls on the New York exchange from USD 1,000 to USD 500 (these are arbitrary, absurd values for the sake of the example).
At that moment, gold is still worth USD 1,000 an ounce in France (€800).
So for a brief moment, you can buy gold at USD 500 in New York and sell it at USD 1,000 in Paris. You have made USD 500. You took no risk, because you sold the gold before the price change reached Paris.
Arbitrage is possible because there are different, interconnected stock exchanges.
TradingView is the perfect tool for arbitrage, because you have access to every asset market.
For example, the euro (EUR) can have a different value depending on whether you price it in US dollars (USD), New Zealand dollars (NZD) or Japanese yen (JPY). Prices balance out over time. But for the euro price to match in pounds (GBP) or Canadian dollars (CAD), traders are needed to arbitrage. They bridge the markets and bring them into balance. Every combination can be tested to identify arbitrage opportunities.
What is interesting is that markets would keep these gaps if there weren’t small, savvy traders taking advantage of arbitrage opportunities. So it is a natural phenomenon, and more than that, it is necessary for markets to function properly.
TradingView Indicators
Finding Potential Trades with Indicators
It is not always easy to come up with a view or an idea to trade. However, you can draw on posts from other TradingView users. With Trade Ideas, you can access all the trades made or suggested by the community. Ideas are sorted by sentiment: bullish or bearish.
Examples of Indicators to Help You Build Your Strategy
- Moving averages
- Pivot points
- RSI and stochastic RSI
- Support and resistance
- Chart patterns (cup)
- Fibonacci ratios
- Fibonacci time zones
- The list is endless: you can edit and create your own custom indicators.
On the free TradingView account, however, you cannot display more than 3 indicators at once. That said, this is more than enough to build an analysis, especially if you use complex ones such as the Ichimoku Cloud, which combines 5 moving averages, alongside simpler but different ones like the RSI or the ATR (Average True Range, a measure of an asset’s volatility). In total, you end up with well over 3 indicators on your screen.
Among These:
TradingView’s indicators also include extreme price values: ATH (all-time high), 6-month high, 6-month low, 14-day average… You will also find fundamental data such as the number of shares, dividends and earnings releases…
TradingView’s Star Indicator: Pivot Points
The most widely used technique on TradingView is probably pivot points. Pivot points are key price levels for an asset at a given moment. They are calculated from several pieces of information, such as extreme or average values over a defined time interval. If the price breaks through these pivot points, it can be seen as confirmation of a significant move.
TradingView’s built-in pivot point calculation, rating: 5/5
What Is the Ichimoku Cloud?
The Cloud was developed by an old Japanese monk living as a recluse in the mountains.
Although he lived apart from society, he regularly went down to the local town to sell his rice harvest.
The monk may have been isolated, but he was no fool. He carefully recorded changes in the price of rice and, in doing so, discovered how to interpret prices to get the most out of his harvests. With the Ichimoku chart, you can use 5 TradingView tools in one go. More than a complex indicator, it is a ready-made trading strategy. It identifies major support and resistance levels, as well as emerging trends. That is all the information you are looking for when you trade, which makes it very handy.
“But If It’s So Good…
…why doesn’t everyone use the Ichimoku Cloud?” you might ask. Well, while it is handy for beginners, professionals end up making the indicator their own and reshaping it by changing the settings, so that in the end it is just moving averages like any others.

How to Use the Ichimoku Cloud
On TradingView, the Ichimoku Cloud is made up of 5 indicators combined to give you a multi-dimensional reading of your chart.
- Tenkan Sen, or conversion line: 9-period moving average
- Kijun Sen, or base line: 26-period moving average
These two moving averages provide a basis for reading the chart. Then comes the “cloud” itself, which is shifted forward relative to the price. This creates a predictive effect: the creator of the Cloud wanted to make it possible to see the price’s future. Hold on tight!
The cloud is an area bounded by:
- Senkou Span A, the average of the first two moving averages
- Senkou Span B, the 52-period moving average of the price.
These two lines are projected 26 periods forward. This may seem a little crazy, but it is a way of representing the price’s momentum: the weight of its past movement shapes its future movement.

But That’s Not All: A 5th and Final Moving Average Completes the Ichimoku Strategy.
The Chikou Span, or lagging line, is a continuous line showing the price, but shifted 26 periods into the past. This shows the price pushing up against its past movements. Once again, the advantage is that it makes the direction of the trend easy to identify. If the current price is stuck below the earlier price, no calculation needed: it is going down!
The Ichimoku Cloud therefore delivers on its promise: showing the past, present and future at a glance. With all this information, you can look for confirmation of your trading strategies.
TradingView’s Ichimoku Cloud, rating: 5/5
Arguably the Best Forex Indicator Combination: Ichimoku Cloud and RSI
How do you combine the Ichimoku and RSI technical indicators?
The first shows you a trend, and the second shows you the strength of that trend. When you look for a correlation between the two, you get confirmation. Trading works by confirmation: you form an idea, then look to confirm it with indicators.
The Ichimoku Trading Strategy Works with Other Indicators, Such as the RSI and ATR.
The Ichimoku Cloud is a complex indicator in the literal sense: it uses several simpler indicators to build a genuine “cloud” of signals. But it is very easy to read visually, which is why beginners have no trouble using it alongside another indicator. While the Ichimoku Cloud tells you about the market trend, you can use the RSI to confirm the Ichimoku signal. How does it work?
You have identified the start of a trend with the Ichimoku indicator. To make sure it is not a false start, you look at the RSI. The Relative Strength Index shows you buying or selling pressure (depending on the direction of the trend, of course!).
If the information from the two indicators confirms each other, you have a buy signal!
The Ichimoku and RSI combination on TradingView, rating: 5/5. Using several indicators on the charting interface is very easy. Ideal for beginners!
What Is a Moving Average?
Moving averages are the most widely used technical indicators on TradingView. They are so practical and useful that many indicators are special forms of moving averages, such as the MA or the MACD (moving average convergence divergence). They are also found in complex indicators such as the Ichimoku Cloud. You can plot a moving average for any data history: the moving average of a price, but also the moving average of volume…

How Does It Work?
A moving average is, as the name suggests, an average: the average of the last N values of a price. You choose N as you like: if it is 1, the moving average equals the price.
That’s right: the plain price is a 1-period moving average.
If N equals 200, the moving average is the average of the last 200 price values. This “smooths” the price, producing a flattened curve that seems to move much more slowly. These curves also act as resistance and support levels for the price, and some traders use moving averages, often combined with other indicators, to build trading strategies.

Moving averages on TradingView, rating: 5/5, like the other indicators in the Indicators & Strategies tab. On TradingView you can configure them however you like: in 3 clicks you can change the period and the chart style, and easily test several different setups. There are also moving averages preconfigured by other users in the Public Library.
What Is the EMA Technical Indicator?
You will find it on TradingView. More than a simple moving average, the EMA gives a lot of weight to time and therefore favors recent data. Like all moving averages, this technical indicator is used to generate buy and sell signals.
EMA stands for Exponential Moving Average. It is a moving average, but it differs from others in how it is calculated: more weight is given to the most recent data, so it reacts faster than a simple moving average. Like all moving averages, it provides buy, sell or trend signals.
Moving averages show a “dampened” version of the price. This lets you compare the current price with its past values and gives you reference points to assess it. An exponential moving average strikes a balance between a dampened view that smooths out all variations and a raw view of the price, where the noise of fluctuations can distort your reading.
Which EMA Should I Use for Day Trading?
The EMA you choose depends on your goals. If you want to trade on short time frames (day trading), you are better off using 8-day or 14-day EMAs. If, on the other hand, you are interested in the market’s deep, slow movements, you can opt for EMAs set to 50 or even 200 days.
Exponential moving averages on TradingView, rating: 5/5
Overall rating for technical indicators on TradingView: 4.6
Renko, ATR (Average True Range)
Price is only the first indicator. When beginners look at an asset’s price, they think it is simple information. But there are 1,000 ways to calculate and display a price. First of all, you need to know which time frame you are looking at. Seconds? Hours? 4-hour periods? Every combination is possible. Next, you choose whether to view the closing price, the opening price or an average price. Finally, there are also display types that optimize the screen to show several data points at once.
That’s How You Go from a Screen Like This

To a screen like this.

Or like this, with the Renko setting

Why the Differences?
To understand the differences between charts and why people invent new indicators and new ways of visualizing things, you have to go back to the origins of trading. Chart number 2 shows what are called Japanese candlesticks. They were developed by Japanese traders in the rice markets of the 17th century. Each “candle” shows the opening price, the high, the low and the closing price, all of which depend on the selected time frame.
Example:
You have chosen the 4-hour display (4h time frame)
Open: value at 00:00
High: the highest value the price reached between 00:00 and 04:00
Low: the lowest value the price reached between 00:00 and 04:00
Close: value at 04:00
A line chart, like chart number 1, on the other hand, is made up of points joined to form a line, which can only hold one data point per period: you can choose the opening price, the closing price, the average of the two, the average of the two extremes… But you are limited to a single piece of information.
The Renko Chart
As for the third chart, the Renko chart, it follows strict rules, which is why it looks so different from the other two. Unlike the previous charts, Renko ignores time and only tracks price movement. If the price does not change and stagnates, the chart shows nothing. It only starts displaying its bricks again (Renko means brick in Japanese) when the price is trending.
The different displays therefore bring out different information. And the one that gives the most information is not necessarily the most useful. On the contrary, some traders try to reduce the “noise” caused by useless information as much as possible.
What Is a Heikin-Ashi Candlestick?
A Heikin-Ashi chart (meaning “average bar”) is a particular type of chart on TradingView. It looks like classic Japanese candlesticks, but the candles are calculated using a method inspired by the moving average. The Heikin-Ashi display therefore combines price smoothing, which filters out false signals, with Japanese candlesticks.
Charting on TradingView, rating: 5/5. In a word: you can do anything. Whether it is display settings or chart settings, you have almost unlimited freedom with the free plan.
TradingView Review: Final Verdict

| TRADINGVIEW PROS | TRADINGVIEW CONS |
|
|
TradingView is by far the best platform in its field, even if there is room for improvement. Proof of this is that TradingView charts are now built into the best trading platforms, because they let you carry out the best technical analysis. So, are you ready? Start trading!
Have you used TradingView and want to share your experience? Leave us a comment!