Ichimoku trading: find out how to trade with the very popular and effective Ichimoku indicator — how to interpret its different lines, individually and as a whole; how to set it up; which settings to use; how to use it; which strategies to combine with it; which trading signals it sends and when; and more.
How to Trade the Markets With Ichimoku Kinko Hyo
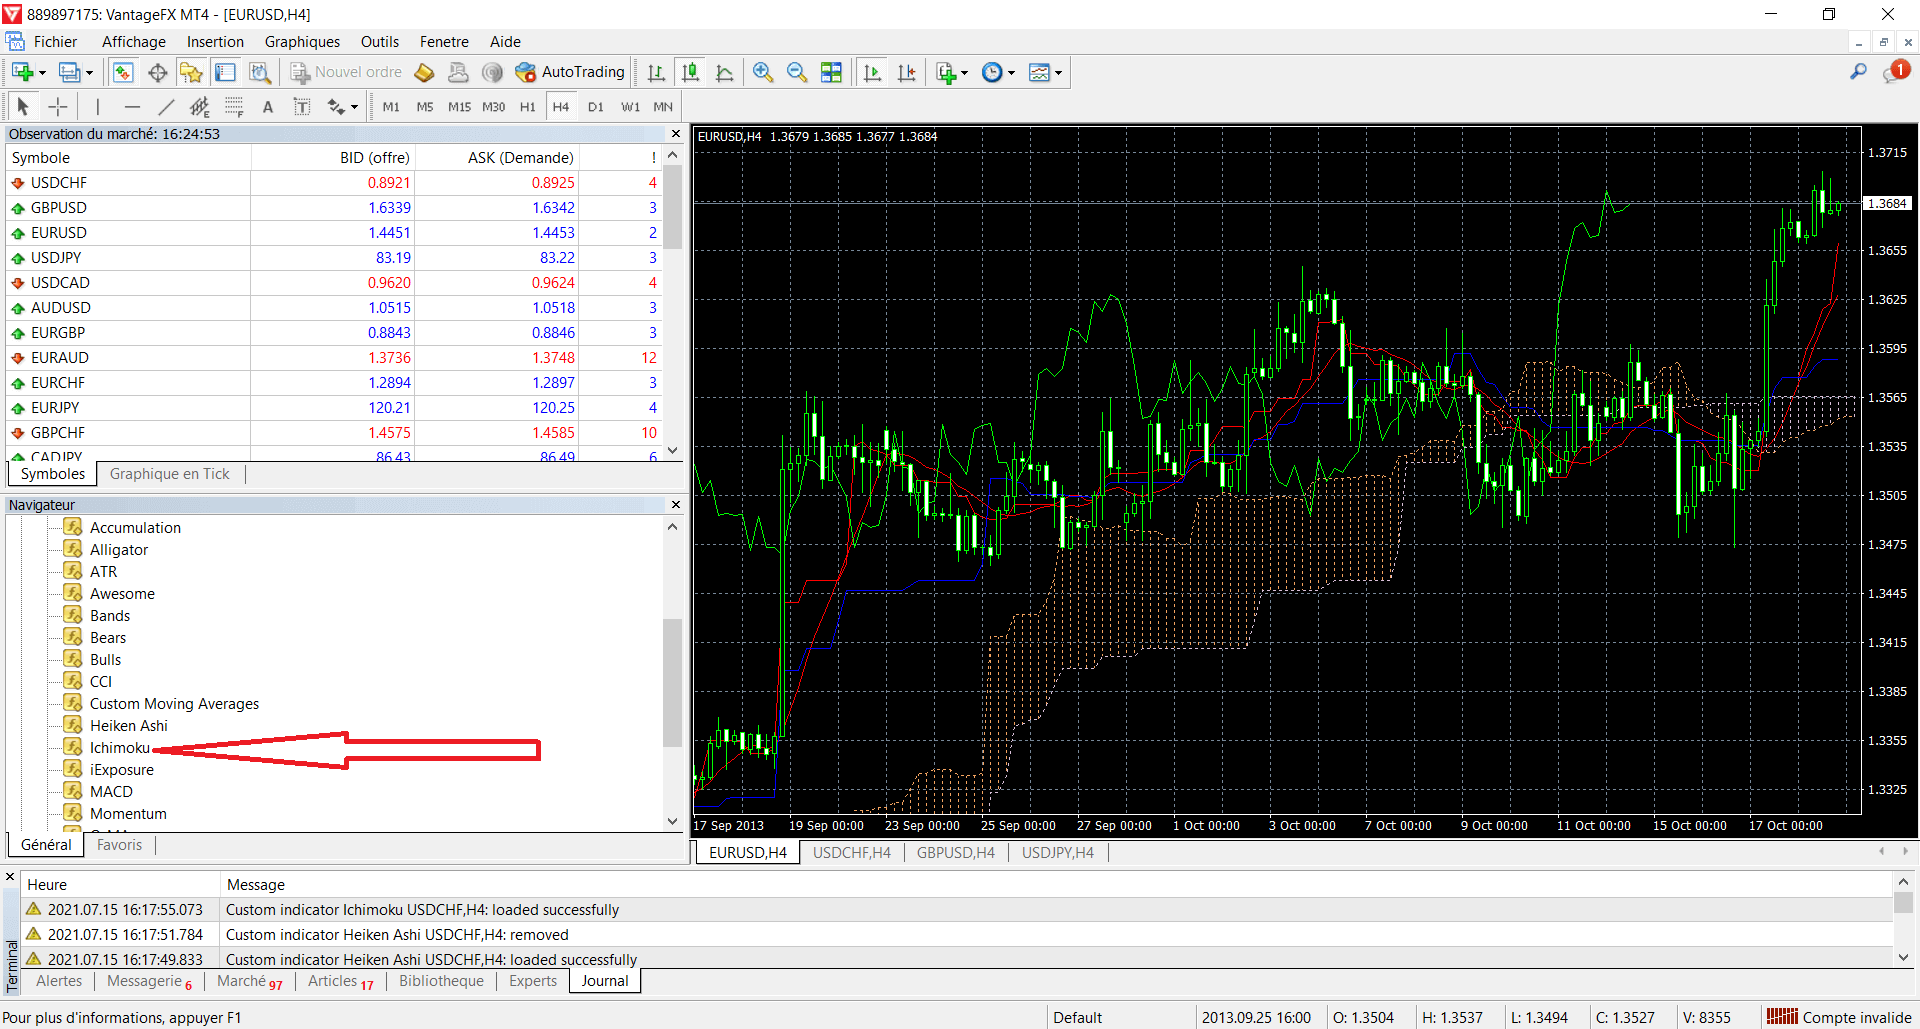
Here is what it looks like on a chart for the EUR/USD pair, for example.
To go further, also read our guides “Trading Sites” and “Trader Salary“.
What Is the Ichimoku Indicator?
Ichimoku means “at a glance”; Kinko means “balance”; and Hyo means “graphic representation” or simply “chart”. Ichimoku Kinko Hyo therefore means “equilibrium chart at a glance” or “the balance of the charts at a glance”. In short, Ichimoku is a technical indicator that represents market equilibrium. That is why beginner traders are advised to learn about Ichimoku trading to deepen their trading knowledge.
So, at a glance at the lines that make up the Ichimoku indicator, you can understand market sentiment, support and resistance, and the strength of the market trend. You can then exploit any breaks in price equilibrium (represented by Ichimoku’s 5 lines) to enter and exit the market.
Ichimoku Trading – The 5 Lines That Make Up the Ichimoku Kinko Hyo Indicator
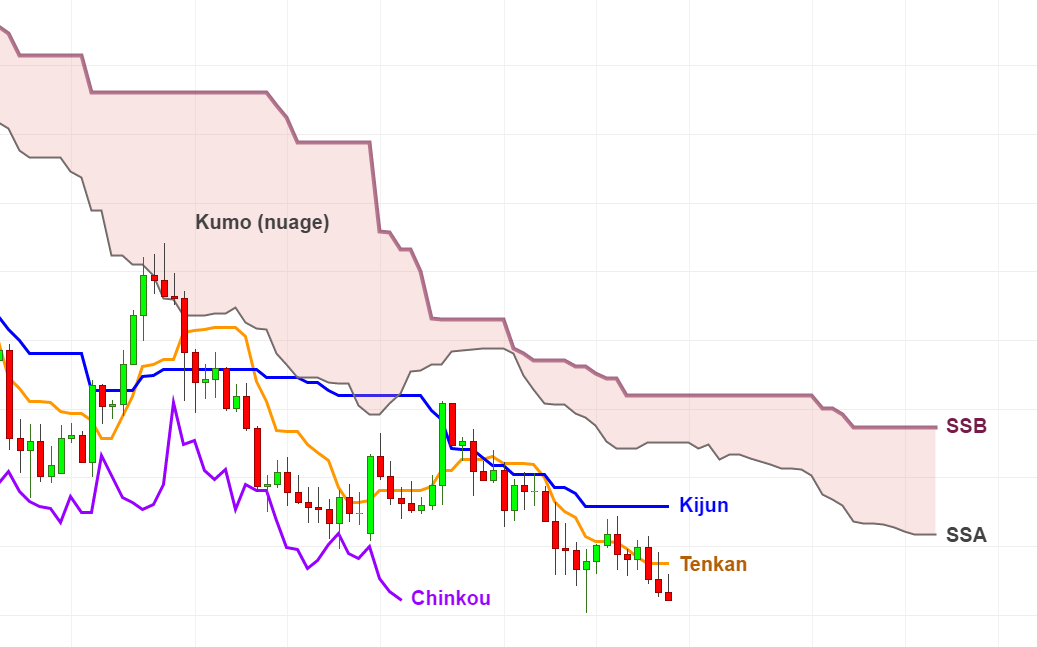
In trading, the Ichimoku technical indicator works with 5 lines: Tenkan-Sen, Senkou Span B, Senkou Span A, Kijun-Sen and Chikou Span. Here is how these lines look in this image by Albert Callisto.
Interpreting Ichimoku’s Tenkan-Sen Line
This line represents the average price of the asset over the last 9 periods, or the last 9 candles on the chart. As the highest and lowest price points change, the average price also changes and moves the Tenkan.
The main role of the Tenkan-Sen line is to flag the health of an asset’s price movement. It also provides valuable information about the volatility of the asset’s price.
Interpreting the Ichimoku Kinko Hyo Kijun Line
Like the Tenkan, the Kijun represents the average price of the asset, but over the last 26 periods. Its plateaus are therefore longer and more pronounced than the Tenkan’s.
The Kijun marks the most important support and resistance levels. Its role in Ichimoku is crucial, as it is the main reference point for placing prices relative to key support or resistance levels.
Interpreting the Senkou Span A Line
The SSA is projected 26 periods ahead of the asset’s price, and it represents the price equilibrium between the short term and the medium term — that is, between the Tenkan (short term) and Kijun (medium term) lines.
Senkou Span A provides information about the likely support and resistance the asset’s price will meet over the next 26 periods. It also reflects the cyclical nature of prices, which often tend to return to equilibrium levels reached in the past.
Interpreting the Senkou Span B Line
The SSB is a projection based on the asset’s price over the past 52 periods. It is Ichimoku’s strongest line. It is generally long and flat, because it only changes when the asset’s price reaches a new low or a new high.
Interpreting the Ichimoku Kumo Cloud
The Kumo, or cloud, is a projection of the asset’s price into the future — specifically, over the next 26 periods. This cloud is what really sets Ichimoku apart from the many other indicators, most of which are rooted in the present.
The Kumo is the area that appears between the Senkou Span A and Senkou Span B lines. It represents the market’s most recent support. In short, when Senkou Span A is above Senkou Span B, the cloud is bullish, and vice versa.
When the asset’s price is inside the cloud, there is uncertainty about future price movements; we therefore recommend not opening a position when the price is inside the cloud.
Interpreting Ichimoku’s Chikou Span Line
It plots the asset’s closing price shifted 26 periods back. This Ichimoku line is considered to represent the market’s memory, because it lets you compare the current price level with the price levels established over the previous 26 periods.
You should not, however, neglect any one line or favor others, because the Ichimoku indicator is the combination of all 5 lines, and each line plays a role in building the indicator.
Trading With Ichimoku: Buy Signals, Sell Signals and Position Management
An Ichimoku buy signal occurs when the asset’s price crosses above the Kijun line. It is a sell signal if the price crosses below it. You still need to make sure the candle has closed to be certain it is a signal.
Likewise, when the asset’s price exits the Kumo cloud through the bottom, it is a sell signal, whereas it is a buy signal if the price exits through the top.
Unlike some sites that don’t know this or never mention it, we point out that these free buy and sell signal indications are only valid when the market is out of equilibrium — that is, in an uptrend or downtrend — and not when the market is in equilibrium (when the lines are moving sideways or flat, or when the cloud is not pointing up or down).
When you detect a signal, you need to make sure it is validated by Ichimoku before opening a position. This validation can be seen on the Chikou Span line, the market’s memory. You need to check that there are no obstacles in the Chikou Span’s path. Only when the Chikou Span has no more obstacles (cloud, trend, Ichimoku lines) ahead of it is the buy or sell signal validated, and you can open a position.
To be prudent, you can manage your open positions with the Ichimoku indicator by placing a stop loss and a take profit. Ideally, place the stop loss around the Senkou Span B line or the Tenkan line.
Free Ichimoku Training
Two important factors explain why proper training is needed to learn Ichimoku as a beginner. The first is that it is a strategy that was long developed solely in the Japanese markets, so the available literature needs a quality translation before it can be used. Second, Ichimoku is based on 5 statistical indicators or lines and 3 theories. This level of complexity can only be absorbed after proper training.
So don’t hesitate to take an Ichimoku course, free or not. Training to master the Ichimoku Kinko Hyo indicator is an opportunity for any trader, especially new traders, because Ichimoku helps you build trading discipline and provides effective reading frameworks that work across many markets.
Why Use Ichimoku Charts on MetaTrader in November
- Get an in-depth read of market volatility thanks to the Tenkan and Kijun lines
- Read support and resistance zones and their relative depth
- Anticipate bullish or bearish market trends
- Get direct signals for managing your positions
- Test and filter the signals obtained to improve your performance
- Identify forex trends
- Find an Ichimoku breakout signal
- Use an Ichimoku trailing stop
Ichimoku Calculation Formulas
The Ichimoku chart consists of 5 mathematical indicators, each represented by a line with its own formula.
Ichimoku Formula for the Kijun-Sen Line
The Kijun line at each point is calculated as follows: sum of the midpoints of the previous 26 periods / 26.
Kijun-Sen, or Kijun, is a line that measures an indicator similar to a moving average. For each period shown in Japanese candlesticks, you calculate the average between the high (highest price) and the low (lowest price) of the period.
Calculating the Tenkan-Sen Line
The formula for the Tenkan-Sen line is: sum of the midpoints of the previous 9 periods / 9.
Tenkan-Sen, or Tenkan, is an indicator based on a formula similar to the Kijun’s. It also uses the midpoints of the periods, but over 9 days.
Ichimoku Formula for the Chikou Line
The Chikou line simply represents the closing price at N-26 periods. The line therefore shows the closing prices for each period, shifted by 26 periods. Also called the Chikou Span or Lagging Span, it uses a very simple formula.
Ichimoku Formula for the Senkou Span A Line
The formula for the Senkou Span A line can be written as follows: SSA (N) = [Tenkan (N-26) + Kijun (N-26)] / 2.
Senkou Span A is therefore calculated by averaging the Kijun and Tenkan lines over a period, then projecting this result 26 periods ahead. The Senkou Span A (SSA) line is thus a forward-looking line, obtained ahead of the period.
Formula for the Senkou Span B Line
The formula for Senkou Span B is: SSB (N+26) = sum of the midpoints of the 52 periods preceding N / 52.
The Senkou Span B line is therefore calculated on the same basis as the Kijun and Tenkan lines: the midpoints of the periods, obtained by averaging the day’s highest and lowest prices. An average of the midpoints is calculated over the previous 52 periods, then projected 26 periods ahead.
 Diversifiez votre patrimoineInvestissez dans l’artDes tableaux originaux, pièces uniques signées par l’artiste. Un actif tangible, loin des écrans et des cotations.Voir les tableaux →
Ichimoku Trading Strategies
The Ichimoku chart and its indicators can be used in several types of trading strategy. Let’s see how Ichimoku can be incorporated into day trading, scalping and swing trading.
Ichimoku Scalping Strategy
Scalping with Ichimoku works on several types of instruments: indices, major forex currency pairs and commodities such as gold. You can set the Japanese candlesticks and Ichimoku lines to different time frames to anticipate short-term movements and scalp with Ichimoku.
For example, the analysis can be built on 30-minute, 5-minute and 1-minute time frames:
- The 30-minute Ichimoku analysis gives you the instrument’s trend and establishes the support and resistance lines within which it will move;
- The 5-minute Ichimoku analysis lets you compare the 5-minute trend with the 30-minute trend;
- The 1-minute Ichimoku analysis then helps you identify the moment to enter a position.
Ichimoku Day Trading Strategy
The Kumo cloud is the most useful tool on the Ichimoku chart for day trading. It lets you set up your day trading strategy so you don’t have to spend the day watching screens.
The key point here is the crossover between the candles (i.e. the price) and the Kumo cloud:
- When a candle touches the cloud from below, it is a buy signal, as the instrument will tend to exit the cloud on the other side
- Similarly, if a candle enters the cloud from above, it is a sell signal
As with the scalping strategy, using Ichimoku charts on different time frames will help you refine your daily strategy.
Ichimoku Swing Trading Strategy
To use the Ichimoku chart in a swing trading strategy, the best indicator is the Kumo Twist. The Kumo Twist is the crossover of Senkou Span A (SSA) and Senkou Span B (SSB), which form the Kumo cloud. When the SSA line crosses the SSB with the latter below, it is a bearish signal. When the SSA line crosses the SSB with the latter above, it is a bullish signal. Since the key to swing trading is anticipating price movements in order to profit from them, Ichimoku fits perfectly into this type of strategy.
Ichimoku Entry Strategies
The two easiest entry strategies to execute with Ichimoku are the Kumo breakout and the Tenkan/Kijun crossover.
The Kumo breakout strategy lets you take positions by following the interactions between the price line and the Kumo cloud formed by the SSA and SSB lines. When the instrument’s price exits the cloud through the upper line, the position to open is a buy. When it crosses the lower line of the cloud instead, it is a short-sell signal.
The crossover between the Tenkan and Kijun lines also provides a reliable signal for entering a position. Depending on where the crossover occurs and where the price is relative to the cloud, the Tenkan-Kijun cross can signal an upward or downward trend.
How to Set Up Ichimoku on MetaTrader 4
Once in MT4, go to the “Navigator” tab, then click on “Indicators”. Scroll down until you see “Ichimoku”, right-click on it and select “Modify”. You can then change all the Ichimoku settings: number of periods, line colors and so on. That is how to install and set up Ichimoku.

Which Ichimoku Settings Should You Use on MetaTrader?
On MetaTrader 4, the Ichimoku settings to use are those of the indicator’s creator, which are the MT4 defaults. However, you can change the periods, color, width and style of the Ichimoku lines, as well as the time frame covered by each Japanese candle.
Here are the Ichimoku settings options in MT4:
- The periods for Tenkan-Sen, Kijun-Sen and Senkou Span B: since these 3 lines reflect price movements over several periods, you can change these periods, although the recommended settings are those defined by the chart’s creator: 9 periods for the Tenkan, 26 for the Kijun and 52 for Senkou Span B.
- The color, width and style of the 5 lines can also be customized.
- The time frame covered by a Japanese candle: the candles used to track the actual price can cover different time frames: 1 minute, 5 minutes, 15 minutes, 30 minutes, 1 hour, 4 hours, 1 day, 1 week or 1 month.
How to Use the Ichimoku Kinko Hyo Trading Indicator
The free Ichimoku trading indicator is used by interpreting its different lines to obtain useful information for taking positions in the market. The analysis can be based on just one of these lines and the actual price, but it is always better to combine several elements of the Ichimoku chart to make accurate forecasts.
For example:
- The Kumo cloud acts as resistance or support depending on whether it is above or below the actual price. It is also advisable not to trade when the price is inside the cloud.
- The thickness and color of the cloud are also used. For example, the relative positions of Senkou Span A and B produce different cloud colors, each pointing to a strong price trend. As for the thickness of the cloud, the thicker it is, the less likely a trend reversal is.
How to Use Ichimoku’s Chikou Span in Trading
The Chikou Span line provides buy or sell signals. If this line crosses the price upward, it is a buy signal (to be confirmed). When the Chikou Span crosses the price downward, it is a sell signal. You can also use the Chikou Span with Bollinger Bands and get the best trading signals from crossovers between these two indicators.
The Chikou Span can also be interpreted on its own based on its position relative to the price. But its predictive power is too weak to rely on it alone when using Ichimoku in trading. The trends it signals can simply be used to eliminate false signals.
How to Use the Tenkan-Sen Line to Trade With Ichimoku
The Tenkan-Sen, or conversion line, indicates the medium-term price trend. The angle of the Tenkan relative to the horizontal therefore measures the strength of a bullish or bearish trend. If the angle is steep, the trend is pronounced; if it is shallow, with the Tenkan line almost flat, the trend is weak.
How to Trade With Ichimoku’s Kijun-Sen Line
Like the Tenkan, the Kijun-Sen, or base line, indicates a price trend, but over the long term (taking 26 periods into account instead of the other line’s 9). It is therefore less sensitive to short-term price movements. Interpreted on its own, it is only significant when it slopes steeply.
How to Use the Tenkan-Sen and Kijun-Sen Lines Together
The crossover between the Kijun-Sen and the Tenkan-Sen is one of the most widely used signals on Ichimoku charts. It is interpreted effectively by taking the distance to the cloud into account. If the crossover occurs inside the Kumo cloud, the signal is neutral or void. If the Tenkan-Sen crosses below the Kijun-Sen, it is a bearish signal, and it is all the stronger if it occurs below the cloud.
If the Tenkan-Sen crosses above the Kijun-Sen, it is a bullish signal, which is all the stronger if it occurs above the cloud. So when the trend indicated by the crossover heads toward the cloud, the cloud will act as resistance or support.
How to Improve the Ichimoku System
The Ichimoku system can be supplemented and improved by adding other tools to the analysis: Bollinger, Japanese candlesticks, Elliott, RSI, etc. These allow better trend analysis and better confirmation of the signals that emerge from technical analysis with Ichimoku.
How to Use Ichimoku on the Stock Market
On the stock market, Ichimoku provides buy and sell signals and helps anticipate trends. For example, if a rising Tenkan-Sen meets the Kijun-Sen, it is a buy signal for the asset you are investing in or want to invest in. You can confirm this signal with the Chikou Span: if it is below the price, the signal is validated. The strength of the signal also depends on the distance between the Kumo cloud and the current price: the higher the price relative to the cloud, the stronger the signal.
Conversely, a bearish crossover of the Tenkan-Sen and Kijun-Sen is a sell signal, to be validated by a Chikou Span above the price. The sell signal is all the stronger when the price is below the cloud.
The price trend itself can be determined from the Kijun-Sen line. When it crosses the price on the way up, it signals an uptrend, and vice versa. This trend will be governed by the Kumo cloud, which acts as support or resistance depending on whether it is below or above the price.
Ichimoku for Forex on MetaTrader 4
For forex trading on MT4, the Ichimoku chart lets you analyze currency price trends and, above all, isolate high-probability trades in the forex market. This helps you anticipate better and make better forex trading decisions, especially when you combine Ichimoku with another indicator.
On the MetaTrader 4 trading platform, you can also set up the Ichimoku analysis tool for currency trading. It supports all currencies. You can adjust the colors, width and style of the 5 standard lines, as well as the chart time frame: from 1 minute to 1 month.
What Are the Bearish Ichimoku Trading Signals?
- When the Chikou Span line crosses the price line from top to bottom. This bearish signal is weak if the price is above the cloud, neutral if it is inside the cloud and strong if it is below the cloud.
- When a falling Senkou Span A meets Senkou Span B. This bearish signal is weak if the price is above the cloud, neutral if it is inside the cloud and strong if it is below the cloud.
- When a falling price exits the Kumo cloud through the bottom.
- When a falling price crosses the Kijun-Sen. The strength of this signal depends on the price’s position relative to the cloud: weak if the price is above the cloud, neutral inside the cloud and strong below the cloud.
- When a falling Tenkan-Sen line crosses the Kijun-Sen line. The strength of this signal depends on the price’s position relative to the cloud: weak if the price is above the cloud, neutral inside the cloud and strong below the cloud.
What Are the Bullish Ichimoku Signals?
- When a rising Tenkan-Sen line crosses the Kijun-Sen line. The strength of this bullish signal depends on the price’s position relative to the cloud: strong if the price is above the cloud, neutral inside the cloud and weak below the cloud.
- When a rising Chikou Span line crosses the price line. The strength of this signal depends on the price’s position relative to the cloud: strong if the price is above the cloud, neutral inside the cloud and weak below the cloud.
- When the Senkou Span A line crosses the Senkou Span B line from bottom to top. The strength of this signal depends on the price’s position relative to the cloud: weak if the price is above the cloud, neutral inside the cloud and strong below the cloud.
- When a rising price exits the Kumo cloud through the top.
- When a rising price crosses the Kijun-Sen. The strength of this signal depends on the price’s position relative to the cloud: weak if the price is above the cloud, neutral inside the cloud and strong below the cloud.
Ichimoku Trading Tips
- In your analyses, give priority to signals based on Senkou Span A and Senkou Span B together. Their combination has very strong predictive power among all the Ichimoku indicators.
- Use the Ichimoku chart across several time frames to build more effective strategies.
- For day trading or intraday trading, Ichimoku charts on H4 (4 hours) and M15 (15 minutes) perform best.
- Identify and control risk when trading with Ichimoku. You need to decide how much capital to commit and also set stops.
- Use the same Ichimoku signals to close a position as to open it.
- Understand the nature of each Ichimoku line and choose different colors to tell them apart clearly.
- Use other indicators, but don’t combine your Ichimoku analyses with too many different indicators. There is a risk of confusion and underperformance.
- Understand how each indicator you use to supplement your Ichimoku analysis works, so you can cross-check and test certain signals and avoid mistakes.
Advantages and Disadvantages of Ichimoku
Advantages | Disadvantages |
|
|
Do you use Ichimoku to trade? Share your experience of trading with Ichimoku Kinko Hyo by leaving a comment below.