 The Renko indicator is one of the most popular tools traders use every day. Discover how to trade effectively with the Renko indicator: how to calculate it, how to analyze a Renko chart, how to set it up and which trading strategies to use with it.
What Is a Renko Chart?
A Renko chart is a tool for tracking price changes on the markets, even the smallest ones. More precisely, the term Renko chart refers to a particular type of price chart that appears as a series of shapes. These are made up of bricks, each drawn at a 45-degree angle to the previous one. The main purpose of this type of indicator is to track and represent price fluctuations while making it easier to detect trends and their reversals.
On related topics, our articles “Gold ETFs” and “Crypto APY” are a good complement to this read.
Renko Trading Indicator – Where Does It Come From?
Developed by Munehisa Homma, a Japanese trader born in 1724, Renko charts are very popular today. Even back then, in the 1750s, their creator’s popularity kept growing, especially after he made a huge fortune speculating on the price of rice. He was also a financial adviser to the Japanese government, and his dazzling fame earned him the nickname “god of the markets”.

This brilliant strategist died in 1803, leaving posterity two works explaining the workings of the financial markets: “Sakata senho” and “Soba sani no den”. It is from these two books that Japanese candlestick theory originates. These masterpieces show unequivocally that the application of Japanese candlestick theory predates technical analysis as we know it today.
Nevertheless, Munehisa Homma is still considered the father of technical analysis, particularly in the field of Japanese candlesticks. Much later, Steve Nison spread his reputation in the Western world in 1991, with the publication of his book “Japanese Candlestick Charting Techniques”.
Why Use the Renko Indicator in Trading in 2025?
Whether you are a beginner or an experienced trader, Renko charts are known to be easier to read. The chart’s markers, called boxes, blocks or, most often, bricks, are more consistent than Japanese candlestick patterns. As a result, they offer excellent visibility for all traders who need this indicator to monitor price changes.
Technical analysis carried out with a Renko chart is much simpler and genuinely effective for beginner traders. Another major advantage is that trend continuation patterns and retracements are easier to spot, allowing traders to target and focus on the most profitable trends.
There is broad agreement that trading with Renko charts can be a good way for those who want to improve certain aspects of their trading. The way the Renko chart draws bricks can greatly influence factors such as patience or impulsiveness during trades.
How to Trade with Renko
To get started with trading in general, there are a few prerequisites. Although the steps are almost the same on all platforms, we suggest the one best suited to beginners: the online broker eToro will make your experience with Renko easier.
Renko and the Stock Market: Renko Settings
A Renko chart has a box size setting that specifies the number of points taken into account for each block. On TradingView, the Renko chart is considered an advanced chart option, accessible directly from the settings menu in the top bar of the screen.
Many charts use both prices and standardized time intervals. Some believe the word Renko comes from the Japanese word “renga”, meaning bricks, because the chart does indeed look like a series of bricks.
How to Analyze Bricks on a Renko Chart
- A brick can be seen as the representation of price movement in predefined amounts. Each brick is positioned at a 45-degree angle, above or below the previous brick. A brick placed above is usually green, while one placed below is usually red.
- It can be tricky to work out the brick size that suits your trading style. A successful Renko scalping strategy, for example, will require a small brick size in order to exploit small market moves.
- You can even use a Renko Scalper EA for greater speed. For day trading, on the other hand, Renko traders will opt for larger bricks, and larger still for swing trading.
- Remember that Renko is a trend indicator, with strategies based on the market price trend. Renko trading signals are therefore very often generated when the trend direction changes and the bricks change color. You can look for trend reversal signals or for signals to follow the current trend.
- Renko strategies are ultimately better suited to trending markets, such as Renko forex strategies, stock indices or certain commodities. These are only the basics, but we will give you more information to help you succeed with Renko trading.
How Does the Renko Chart Work on MetaTrader 4 and MetaTrader 5?
By default, the Renko indicator is not built into MetaTrader 4 (MT4) or MetaTrader 5 (MT5). However, if you know how to use MT4, you will know how to install an indicator on the platform. In practice, brokers offer a Renko indicator for MT4 and MT5 to download as an EA (Expert Advisor). With the free EA version, you can download a Renko indicator for MetaTrader 4 (MT4) and MetaTrader 5 (MT5).
Setting Up a Renko Chart on MetaTrader 4 and MetaTrader 5
After installing a Renko indicator on MT4 or MT5, you need to configure it to analyze charts. The indicator is usually set to a default value of 10 pips for chart analysis, whether on the forex (FX) market or another financial market. Whether on the mobile or online version, the MT4 or MT5 EA makes it easy to draw bars on Renko charts.
How is a bar drawn? A chart with bar construction set to the default value of 10 follows a particular Renko strategy: only a price move (up or down) of at least 10 pips will form a new block. The creation of a brick in MetaTrader Supreme Edition therefore depends on the asset’s price, and no one can say how long it will take.
Using a Renko Chart Offline on MT4 or MT5
One of MetaTrader’s great advantages is that the platform can be used offline. An offline chart means that, in addition to displaying the Renko chart live on MT4 or MT5, the platform keeps displaying the chart offline to make analysis or research easier. Even after closing the platform, the chart will be displayed when you reopen MetaTrader. However, you must not close the chart if you want to keep seeing it.
Automated Trading with Renko on MT4 and MT5
The Renko indicator is very easy to use for buying and selling assets. That is why many traders consider automating the process to manage their positions more easily. This is possible, but it requires advanced skills in using the Renko indicator as well as programming skills in MQL4 or MQL5.
Only a professional able to use the MQL4 market can improve their trading with a Renko bot. They will create an Expert Advisor to be used on MT4 or MT5. But for those who lack the skills to create a Renko EA for MT4 or MT5, the question is: how to trade?
Automated trading is still possible in this case, thanks to Renko EAs available on a marketplace offered by the MetaTrader platforms. You can download these bots for free or buy them. However, you should know that this is risky, as the robots are not certified or validated, so no results can be guaranteed. If you plan to use one, we recommend testing it on a demo account to evaluate its performance.
Renko Indicator Formula and Calculation in November
As you already know, a Renko chart is based on bricks, or blocks, whose size is set by a unit of change. This unit can be either a predefined number of points or a certain percentage. Put simply, a new brick is added to the Renko chart when the price has moved up or down by the chosen unit. In line with this principle, Renko charts based on other formulas are rare on trading platforms.
For example, you can find Renko charts based on high and low prices. Other Renko charts focus more on price behavior between an asset’s opening and closing prices. With so much information, you will need to calibrate your strategy carefully according to your goals.
Calculating the Price Unit – The Single Price Method
As you know, there are many formulas for calculating the box size of a Renko chart. However, if you are not familiar with this chart, especially if you are new to trading, we recommend the first method, which uses a single price. These pointers will help you:
- You can apply the Renko unit of change to the market’s opening price.
- You can also apply the Renko unit of change to the highest price.
- The lowest price can also be used as a reference for applying the Renko unit of change.
- You can also apply the Renko unit of change to the market’s closing price.
Calculation with the ATR Indicator
With this method, instead of choosing a fixed brick size, you work with dynamic support and much more precise resistance levels.
Among the available methods, some Renko trading software offers users a rather novel solution: using the ATR indicator to calculate the size of Renko bricks. In practice, if you want a dynamic reading of price through Renko blocks, you can use a brick size determined by the ATR (Average True Range) indicator.
How to Read and Interpret a Renko Chart in Trading
By nature, a Renko chart displayed on TradingView, ProRealTime or MetaTrader is a chart that shows trends. The first thing it tells you, therefore, is whether the market is moving up or down.
 Diversifiez votre patrimoineInvestissez dans l’artDes tableaux originaux, pièces uniques signées par l’artiste. Un actif tangible, loin des écrans et des cotations.Voir les tableaux →
Reading a Renko Chart
Traders who use Renko charts also keep a close eye on trend reversals. These are very easy to spot through a change in brick color. A change in the Renko chart’s color alerts traders that the trend they were following has reversed, and that the price is now likely to move in the opposite direction. A Renko chart will not give you as much information and detail as a Japanese candlestick chart, but that is precisely what makes it easier to read and monitor.
Keep in mind that Renko bricks are not drawn according to time but solely according to upward or downward price movement.
When volatility is low and prices are static, bricks take longer to form. Conversely, if volatility increases and prices start trending, bricks will form much more quickly. In practice, a Renko bar can take a few seconds, several hours or even days to form, depending on market volatility.
Along the same lines, Renko brick size also plays a key role in how often bricks form. The larger the brick size, the longer it may take to form; the smaller the brick, the more quickly it is likely to form.
Interpreting a Renko Chart: Following Trends
The information above shows that, if the overall trend is upward, i.e. with a long series of blue bricks, a trader following this asset can buy if a blue brick appears after one or two red bricks. This signals a resumption of the uptrend after a short pause.
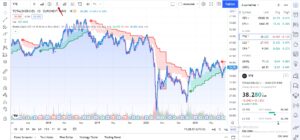
The same principle applies to a downtrend. As you can see, Renko charts can be very useful for traders. They help identify trends as well as potential reversal zones. The chart’s simplicity makes it easier to visualize price movements and Renko trading signals.
Interpreting a Renko Chart: Trend Reversals
A trader can, for example, buy the market when a bullish brick appears after a series of bearish bricks, as this signals a potential trend reversal and a continuation of rising prices. Conversely, they may decide to sell if bearish bricks appear after an uptrend. With this approach, significant profits can be expected when a new trend reversal forms.
Pros and Cons of Trading with Renko
Pros | Cons |
|
|
How to Use Renko for Trading – Which Strategies to Use?
There are several Renko trading styles. Depending on your expectations, choose the one that suits you best.
The Wick Strategy with Renko Trading
Unlike standard versions, Renko versions with wicks show all the small moves against the current trend. In other words, you can see minor bounces and pullbacks that were not strong enough to form a reversal brick.
Unlike Japanese candlestick wicks, Renko wicks only appear on one side of the brick, the side opposite the trend. The wick tells the trader that prices tried to change direction but failed. This information allows them to build more advanced Renko trading strategies.
The Scalping Strategy with Renko Trading
This trading technique involves buying and selling on the market over very short periods. Scalpers who use this method simply aim to take a few points from the market. Renko scalping strategies are mostly applied to derivatives with higher leverage. The gains made on each position are small relative to the risk taken. However, the main advantage of scalping with Renko lies in the number of winning positions you can accumulate.
This method is also the fastest way to trade, after high-frequency trading of course. Of these two techniques, scalping is certainly the only one within reach of retail traders, since high-frequency trading requires very expensive professional equipment and, above all, an extremely fast internet connection.
Day Trading with Renko
- Day trading is a short-term investment strategy that is compatible with Renko analysis. Traders who use this strategy use Renko for day trading to change positions from one day to the next. They generally prefer to close their positions at the end of each day and open new ones the following day.
- Those who want to make gains by placing orders within the same day often ride small price moves. By using financial derivatives, they can place several orders on markets, whether bullish or bearish.
- Day traders must think differently from other investors. They need to focus on the asset’s price rather than its long-term potential. That is why day trading strategies are usually based on a large amount of technical analysis, while requiring the investor to closely follow all the latest news that may influence market prices.
Swing Trading with Renko Charts
Swing trading is a type of trading in which the investor tries to generate profits over a period of one to four days. This method mainly appeals to day traders and retail traders, since large institutions trade amounts that are too large to make such quick trades in stocks.
This technique is trend-based. It aims to take a position at the start of a trend and exit when signs of exhaustion appear. The main difficulty with this approach is finding the best point to join the trend. However, finding the best time to exit the market is even harder. The trader must therefore be very vigilant and quick.
Should You Trade Renko on Its Own or with Technical Indicators?
The Renko indicator can be used on its own to analyze charts as part of a trading strategy on the forex market or other financial markets. However, it can also be combined with other technical indicators in different strategies. Whether you are in France or another country, you can get buy and sell signals using Renko alone.

It can also be combined with some of the best-performing technical indicators. You can pair Renko with the MACD (Moving Average Convergence Divergence), the Stochastic indicator, Fibonacci, the RSI (Relative Strength Index), moving averages, Donchian channels and even Bollinger Bands.
Renko vs Price Action
Alongside the Renko indicator, price action is one of the most reliable approaches used by traders. The two can be combined, as they complement each other perfectly. Price action shows the price movements of an index or asset on the market. According to many professionals, price is the main piece of information on which other technical indicators base their analysis.
Most technical indicators are based on price movements, which often explains why they lag during trend reversals. By combining Renko and price action, technical analysis of the CAC 40, for example, becomes fairly easy.
Renko vs Ichimoku
Like Renko, the Ichimoku indicator shows the market trend. However, unlike Renko, Ichimoku is much harder to read and use in a trading strategy. It has a particular method that makes it a complete trading system. The Ichimoku indicator does not replace Japanese candlesticks on the chart; it consists of 5 lines overlaid on the price curve. The image below shows the Ichimoku indicator lines:

Conclusion – Should You Trade with Renko in 2025?
Whether you are a beginner or experienced, trading with Renko can only be a great ally. It adapts easily to the best trading strategies with the Renko chart indicator. For beginners, starting to trade with Renko charts, which are much simpler, before moving on to Japanese candlestick strategies is a gradual, lower-risk approach.
If you are a little more experienced and struggle with other chart types, Renko helps you keep a clear head. Likewise, if you are anxious and prone to panic every time a candle does something unexpected, Renko helps you stay in the trend for as long as possible.
If you are an investor who mainly uses Japanese candlesticks, the Renko indicator can help you refine your technique. If you need confirmation, or want to easily identify levels, divergences and trends, Renko can certainly help you validate or even improve your candlestick analysis.
Without a doubt, the clarity of Renko bricks makes signals easier to identify. In addition, filtering out market noise considerably reduces the high volatility shown by other trading chart types.
Struggling to understand some aspects of the Renko indicator? Leave us a comment and we will help you solve your problem.